|

|
 ManageEngine VM Health Monitor
-
Version
1.0
Virtual servers, as opposed to real physical servers,
provide great cost benefits. The applications,
services, together with the virtual servers, need to be
up and running all the time. Any outages or
performance degradation in the virtual servers, will
affect the users of these applications and services.
Hence it becomes imperative to monitor and manage those
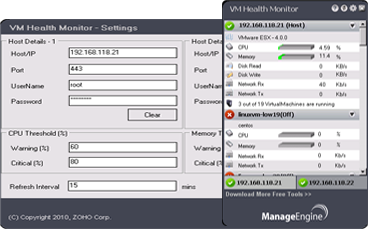
virtual servers continuously. The Free "ManageEngine
VM Health Monitor" tool will address this monitoring
requirement. The ManageEngine VM Health Monitor tool,
as the name implies, monitors important parameters of
VMWare ESX and ESXi servers. The tool fetches
comprehensive data about the servers and presents them
as visually elegant graphs and reports. The relevant
data, graphs and reports are displayed in a desktop
tool dashboard providing wealth of information about
the real-time functioning of the virtual servers. The
"ManageEngine VM Health Monitor" tool can monitor two
VMWare servers simultaneously. ManageEngine VM Health
Monitor tool provides an exclusive ESX / ESXi
monitoring, as a desktop tool dashboard. It shows the
actual resource utilization of the virtual servers
alongwith CPU and memory utilization for each guest OS
on the ESX / ESXi server. The dashboard quickly shows
how many virtual machines are present, how many are
powered on/off or suspended, how much CPU and memory
are allocated to / consumed by each virtual machine
etc., in an intuitive bar graph. Using the tool,
administrator can also set threshold values for CPU and
memory usage, like critical and warning thresholds. If
at all, the virtual servers behave abnormally and the
CPU and memory utilization dangerously crosses the
threshold limits, alert signals are shown in the
dashboard tool. The IT administrator can then
effortlessly manage instances to prevent server crash,
or bring back the serveres to normal functioning state.
The ManageEngine VM Health Monitor tool comes handy.
|